JTree component is very well suited for showing the contents of your file system. In this entry, i’m going to show how you can do it, pointing out a few interesting issues along the way.
The full source for this example can be found here. It contains the following functionality:
- The
FileSystemView object to query the contents of the local file system.
- The
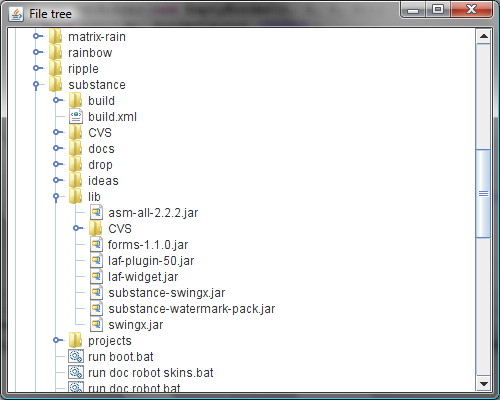
FileTreeCellRenderer to render the single file cell. It has two caches, one for storing the file icon, and another for storing system name for file system root. The second one if very important for performance since on some systems the call to FileSystemView.getSystemDisplayName can take considerable time. Note how we use the FileSystemView.getSystemIcon to show the system-consistent file icon (see screenshot below).
- The
FileTreeNode to present a single tree node. Note that the JTree implementation will not create the entire model (which is very good for the initial state where all the file system roots are collapsed).
- The main panel that creates the tree, sets the model and the renderer and wraps the tree in a scroll pane. Note that we use
File.listRoots to get the file system roots and JTree.setRootVisible(false) to remove the main tree root (so that we have “multi-root” tree, with each file system root being a top-level tree node) – see screenshot below.
Here is how it looks:
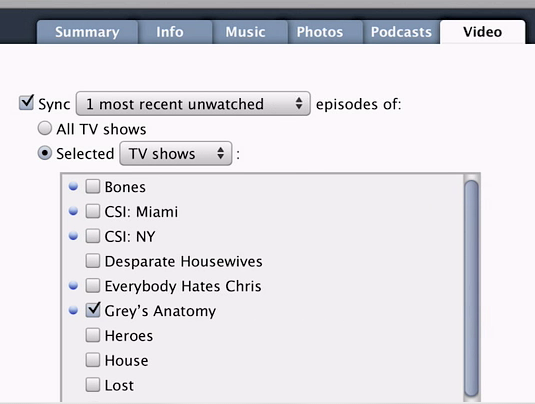
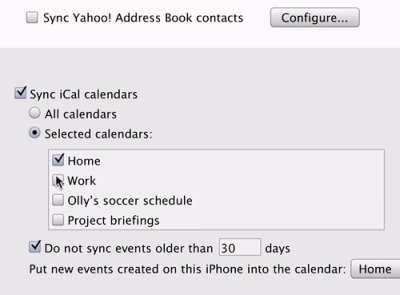
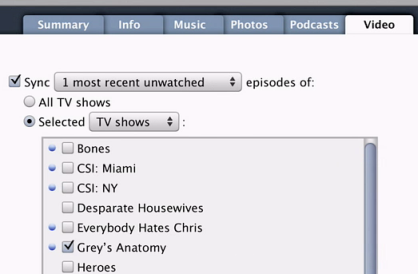
Judging by the applications coming lately from Apple (such as native controls in Safari on Apple and iPhone), Aqua is as good as dead. Here are two screenshots from the latest iTunes (taken from the activation guide just posted on Apple site). Click to see full-size images.
Does this mean that the system look and feel will no longer be apple.laf.AquaLookAndFeel? Will it go back to com.apple.mrj.swing.MacLookAndFeel? Or maybe Apple JDK 6.0 will have a brand new class with a brand new name? Or maybe Apple will choose the same route as Sun did with JDK 5.0 and extend AquaLookAndFeel with a new theme (re: Metal / Ocean)?
By the way, is this the new look for tabs?
Yesterday i closed one of the longest-standing open bugs in Substance. My unofficial policy is to fix 90% of the bugs (whether they are reported via the Issue Tracker, forums, mailing lists or privately) in the first day or two. This way, not only do i keep the submitter in the “context” of the bug, but also the bugs don’t pile up closer to release – enough of that at work :)
However, some bugs are reported against very general areas. Most noticeably, two of these are performance and memory leaks. The first one is top priority – a look and feel shouldn’t take the CPU even when the CPU is available. My goal is to have no more than single-digit overhead in CPU (preferably under 5%). To attain this, Substance uses a lot of image caches, which significantly speeds up the rendering process, especially since Substance provides a lot of animations. However, some lower-end machines are not well-suited for such a Java2D-heavy library, and in this case it might be better to either turn off all the animations or use another look and feel (a comprehensive list is available here).
The second issue (memory leaks) is very tricky. Consider the original bug report, which has an infinite loop, where every iteration creates an instance of SwingSet2 and then disposes it. The memory consumption of such an application should remain constant, since every instance of SwingSet2 is disposed, and this is what is happening under core LAFs (such as Metal or Windows). Under Substance the behavior was far from optimal – this is how the heap consumption looks under release 3.3:
1: heap taken : 23925
2: heap taken : 28226
3: heap taken : 32589
4: heap taken : 37185
5: heap taken : 37872
6: heap taken : 42241
7: heap taken : 46626
8: heap taken : 50896
9: heap taken : 51921
10: heap taken : 56496
11: heap taken : 59114
12: heap taken : 60892
13: heap taken : 64628
SwingSet2 is a big application which tests pretty much all of the Swing core controls. Although it’s unlikely that a real application will run such a scenario, this is still a serious memory leak. Or rather, multiple memory leaks. So, it took me almost six months to track all (hopefully) these, and the latest 4.0dev drop provides the following heap consumption:
1: heap taken : 24216
2: heap taken : 23703
3: heap taken : 25708
4: heap taken : 25781
5: heap taken : 25803
6: heap taken : 23668
7: heap taken : 25669
8: heap taken : 25748
9: heap taken : 25785
10: heap taken : 23697
11: heap taken : 25819
12: heap taken : 24796
13: heap taken : 25770
14: heap taken : 23682
15: heap taken : 25830
16: heap taken : 24821
17: heap taken : 25857
18: heap taken : 23713
19: heap taken : 25832
20: heap taken : 24840
21: heap taken : 25815
22: heap taken : 23693
23: heap taken : 25858
24: heap taken : 24819
25: heap taken : 25857
26: heap taken : 23716
27: heap taken : 25830
28: heap taken : 24730
29: heap taken : 25820
30: heap taken : 23707
31: heap taken : 25849
32: heap taken : 24816
33: heap taken : 25850
34: heap taken : 23710
To trace the memory leaks i used a very low-overhead Ariadna tool, which is quite similar to JHat. Initially, it shows a list of all classes, along with a number of live instances. Click on the class name, and it shows the instances. Click on the instance, and it shows the path to a heap root that holds this instance. Of course, it’s not as effective as a UI-based tool (such as JProfiler or JProbe), but if you know your code, it should be more than enough for the first stage (detecting the easiest or most frequent memory leaks).