Android performance bits and pieces, part I – measure everything
There’s this great saying in Russian – доверяй но проверяй. It means “trust but verify”, except it doesn’t have quite the same visceral impact. Probably because it doesn’t rhyme in English. Anyhow.
We got to spend some time in the latest Play Store release to improve scrolling performance. There’s a lot of rules that you can come up with. The most important one for me is – measure everything. If you don’t measure and just blindly start “optimizing”, you’re just treading water. You can improve some things. Or you can make some things worse. And then there’s another rule – trust nobody. Not even the framework code.
In this release we started to support sale prices. Items that are on sale will show the full price as grey strikethrough text right next to the full price.
My first thought was to add another TextView to all cards. But I was right in the middle of a larger refactoring to reduce the number of views on cards (which is a topic for another entry). So that would’ve been quite awkward. And then I though about spans. We essentially have two spans, one for full price, and another for current price. So I whipped up a CL that switched from TextView.setText(String) to use a SpannableStringBuilder with three spans (color+strikethrough for full price, color for current price). It looked as expected, and after testing a few data scenarios I submitted it for review. Then it went in. And then our testers filed a bug about ANRs on scrolling book streams. And general poor scrolling performance on those streams.
And then I started measuring the actual performance of using SpannableStringBuilder on TextView. Because you know, you kind of rely on framework APIs to not only work correctly, but also be fast. Except when they are not fast.
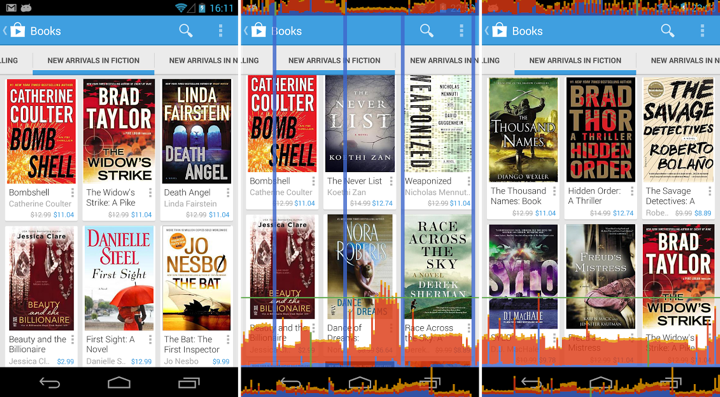
It turned out that using spans is expensive. And by expensive I mean that the cycle of creating spanned content, setting it on the TextView, measuring and drawing it comes up to around 6ms (see links at the end). For one card. Say you have nine cards visible. That’s 54ms. Just for prices. Which is what you see as freakishly tall blue spikes in the middle screenshot. They kind of kick in every time we populate the next row of cards.
Luckily it was found in time before it went public. We ended up creating a custom view that measures and draws these texts with explicit calls to Layout, FontMetrics and Canvas APIs. The performance went down to what we had before. It’s even slightly better than pure TextView with String content, as we could make a few assumptions that the text is always single-line and never elided. So we’re back to normal. Well, you do see a single spike going above the 16ms threshold in the right screenshot, but we’re not done with improving our stream scrolls.
So the lesson is – measure everything. Trust nothing. Even the framework code that’s been there since API v1.
