Animations 101 – from point A to point B
Movement is all around us in the physical world. We take it for granted since we see it from the moment we’re born. Today, i’m going to talk about a seemingly mundane act of moving from one given point to another given point. I would imagine that if you’re reading this, you most probably enjoyed your math lessons in middle school, so the following drawing should be familiar:
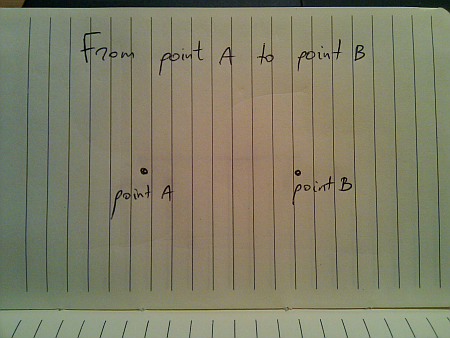
In a perfect world (imagine a deserted highway), moving from point A to point B is just following the straight line:
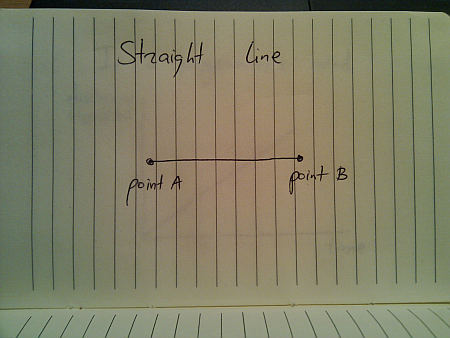
And if you’re a programmer, this is how you would implement this journey:
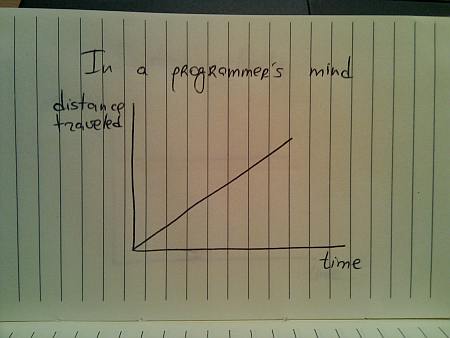
While this seems quite straightforward (and i have seen quite a few presentations that use linear animations), this falls apart once you translate the traveled distance to velocity:
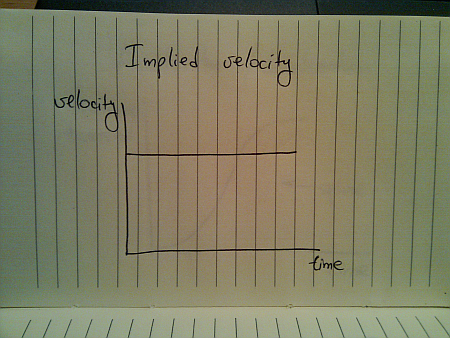
This is hardly the way things move in the real world (be they man-made, inanimate or animate). The usual approach taken by the existing animation libraries is to use a variation of spline (or perhaps a sine / cosine wave) that looks like this:
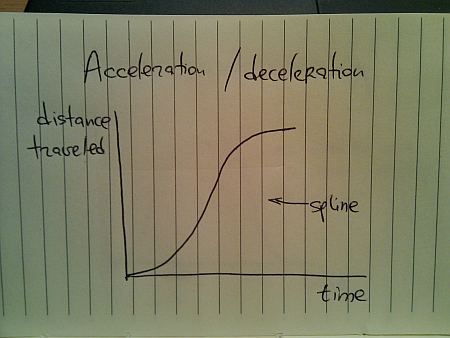
Here, you start from zero velocity, accelerate as you go, reach your maximum speed towards the middle of your journey and then start decelerating towards zero speed as you reach your destination. Translating the distance traveled to velocity, we get this:
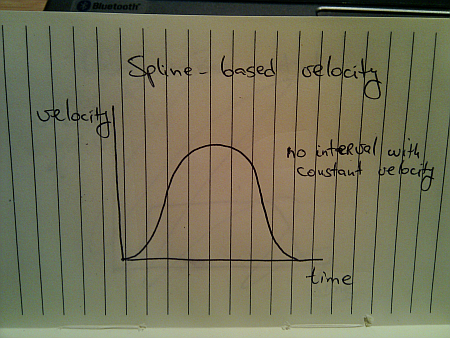
Once again, this is not how things move in the real world. A moving body (human, animal, vehicle or other) has a certain speed limit and a certain preferred speed. It takes some time to reach that speed, but once you get there, you stay until it’s time to decelerate:
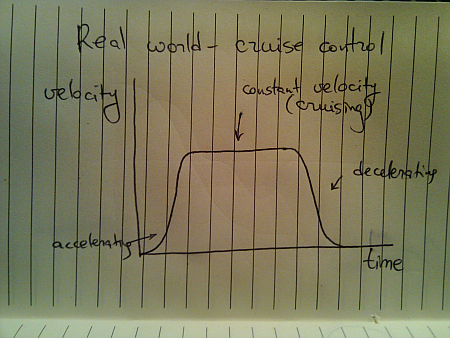
This is a better approximation of a slightly less ideal movement. The velocity graph models the “cruise control” mode that you’d employ on a deserted straight highway. Translating the velocity to distance traveled, we get this:

Here, we have a curving acceleration (might be a spline, a sine or even a quadratic curve – depending on the way the object is accelerating), followed by the perfectly linear segment which ends in a curving deceleration.
All the examples above assumed that you’re supposed to arrive at point B and just stop there. That is not always the case:
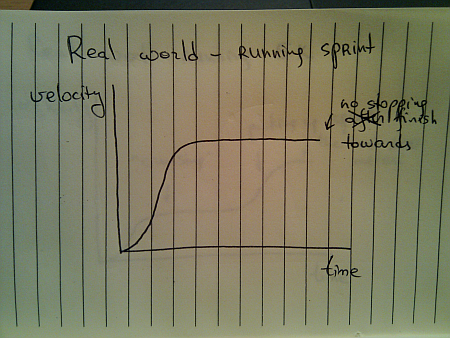
You do stop once you reach the sprint finish line, but you don’t stop until you reach it. Once you gain your maximum speed, in the ideal world you’ll be able to maintain it – especially over a very short distance.
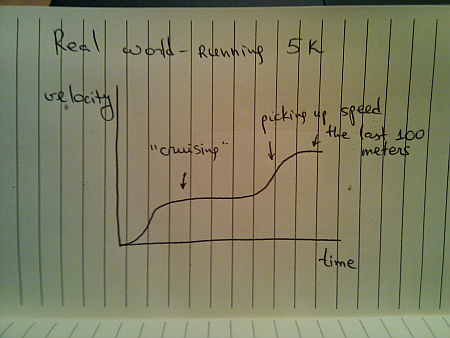
When you’re running sprint, it doesn’t really matter what are your opponents doing. They are running on parallel tracks and do not interfere with your pace. However, if you switch from running sprint to running a longer distance (say 5K), the story gets quite different, and the most common velocity graph looks like this:
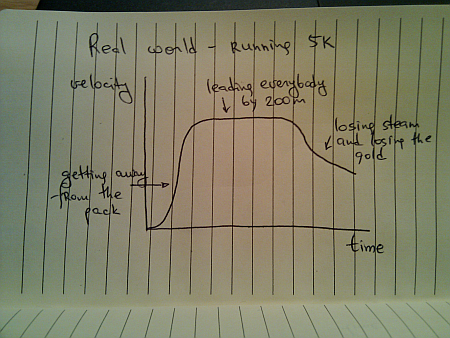
Of course, some runners try to outsmart the competition and end up running like this:
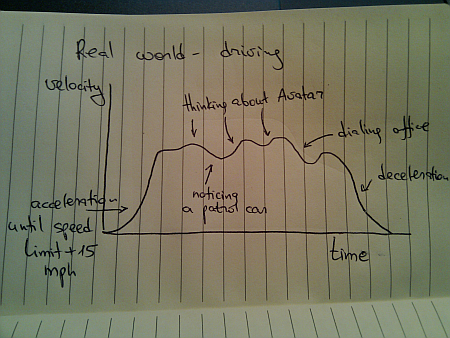
Once you leave a deserted road and have some traffic around you, you cannot always use cruise control. Even if you’re on a straight highway, your velocity graph will likely look like this:
Of course, these graphs are nothing new. We see countless movements of physical objects around you every day. All you need to do is look beyond the simplified approach of “train is moving with constant speed of 40mph” and start analyzing the real world.
To be continued tomorrow.
